
What is Data Flow Diagram?
In a business information system, some of us have noticed a graphical representation of the entire flow of data taking place with the help of a diagram. This diagram is known as a data flow diagram or DFD. A data flow diagram is a graphical representation of the flow of data taking place in a business information system. It provides ample information about customer details, account details, transaction history, deposit amount, withdrawn amount, updated account balance, orders placed, details of the brokers, etc. The processes which are involved in a business information system in transferring data are graphically represented with the help of the data flow diagram.
The data get transferred to the file manager from the inputs to generate reports. We can find physical and logical data flow diagrams. The physical data flow diagram mainly describes the physical implementation of data flow on the logical ground. On the other hand, the flow of data through a particular system in performing certain specified functionalities of business is described by the logical data flow diagram. It is important to understand why a business information system needs to represent the flow of data transfer with the help of either logical or physical data flow diagram.
The graphical representation taking place through DFD helps in representing the processes and the functions which are capturing manipulating, storing, and distributing data between the environment of an information system and the entire information system and also between various system components. These elements get represented graphically with the help of the flow diagram.
Data flow diagram helps in providing logical information and the flow of business information system. It also helps in determining the requirements of physical system construction. It enhances notation and simplicity and establishes automatic and manual system requirements. There are mainly four symbols of flow diagram such as process, data store, external entity, and top-down decomposition technique. The process receives data input and provides output with a different form or content. We can have a simple process where data are collected and saved in the database.
On the other hand, we can also have a complex process where a report is produced which contains details of monthly sales of any retail stores. Every process gets assigned with a particular name which helps in identifying their functions or performance. Data flow indicates a path through which the data from one end of the information system moves to the other end. It may represent an element of data. For example, customer id can be represented in a data flow. Datastore is the repository of data which is used in representing a situation in the flow diagram. The situation which is represented by data stored indicates the retention of data in the system.
It is very important in the data flow diagram because single or multiple processes are needed in the usage and the recorded data in the data store are used for future references. Top-down decomposition technique is also known as levelling. It is a method which is used to portray detailed information of the lower-level data flow diagrams.
Levelling is produced by the help of a series of diagrams having more detailed information until the desired detailing gets achieved. An external entity is a department or a person or an outside organization which provides information and data to the information system and also receives output from the information system. External entities can also be defined as the components found in the outer boundaries of a business information system.
The external entities help represent the interactions between the outside world and the information system. The external entity is represented by a rectangle in the flow diagram. These external entities either receive data or supply data but they do not process data. There is a difference between physical and logical data flow diagrams. The physical data flow diagram portrays the ways the system would be implemented. On the other hand, logical flow diagram portrays on the ways business gets operated and it mainly focuses on the core areas of the business. Our experts from Instant Assignment Help had made infographics for you to make it simple to understand.
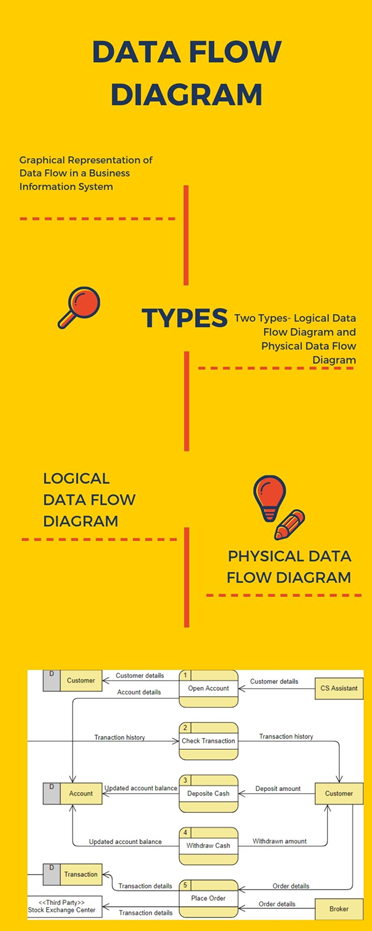
Two types of Data Flow Diagram-Logical and Physical Data Flow Diagram
Logical Data Flow Diagram
There are two types of data flow diagram logical and physical flow diagram. A logical flow diagram is that type of flow diagram which mainly focuses on business activities and the business as a whole. It can be considered as the fundamental basis of physical flow diagram because by modifying the logical flow diagram, we can get the physical flow diagram. Logical flow diagram explains data and business events which are necessary to accomplish the business events. A physical flow diagram can be developed based on a logical flow diagram.
Physical flow diagram depicts the working of the data in the system with the support of paper files, Software, Hardware, and people involved. The flow of business activities and actions are mapped by the help of a logical flow diagram. The inefficiencies and shortcomings of a system get clarified by the help of a logical flow diagram. The steps involved in data process in eliminating and modifying the data are also obtained from the logical flow diagram. The non-technical people can easily understand the mechanism of a logical flow diagram. It is a commonly observed diagram in any business.
The functionality can be understood with the help of a logical flow diagram even without implementation. Logical data flow diagrams also provide in-depth information and help in understanding the system. It helps to identify shortcomings, inefficiencies, and mistakes. It is an essential diagram because it helps to eliminate the risks associated with data processing in the system.
It elaborates the flow of data so that functionalities can be made better without technical solutions or without implementing the actual system. Logical flow diagram helps to explain the ways a business can be operated or business gets operated in real. It mainly explains the business activities. The data store of the logical data flow diagram represents the collection of data regardless of the ways such data have been stored. The data source for the logical flow diagram represents only the collections of permanent data. The business controls are well- depicted by the help of a logical data flow diagram.
Physical Flow Diagram
A physical flow diagram is created after the creation of a logical flow diagram. Physical data flow diagram explains the best-suited method to implement any business activity. It is involved in the physical implementation of various inter-related devices and files which are required for processes of the business. Physical data flow diagrams provide detailed information about external components, hardware, software, and people involved to operate the business processes.
It is mainly concerned with the ways the system can be implemented or explains the operations of the current system in a business. It presents the program modules, programs, and manual procedures. The data stored of physical data flow diagram represent databases, physical files, and manual files. Different sources of data such as transaction files and master files are found in the case of physical data flow diagrams. Any processes which can operate at different times should get connected by a particular data source. Physical data flow diagrams show various controls which are needed to validate input data or to obtain a record. These controls help ensure effective completion of any process or system security. After explaining the types of Data Flow Diagrams, our Assignment Help experts will tell you the difference between physical and logical data flow diagrams.
Difference between Physical and Logical Flow Diagrams
The logical data flow diagram is not at all concerned with the ways the information system gets constructed. Therefore, in the case of logical data flow diagram we can easily overlook implementation specifics like data storage, technology, computer configuration, message passing methods for communication and the focus can be given on the actual performance of the system. The system is engaged in performing data, collection data, information transformation, and reporting.
Physical data flow diagram represents the ways the information system or the system dealing with information and data can be implemented. It includes software, hardware, people, and files to get engaged in the system. It is mainly developed in such a way that the processes which are described by the help of logical data flow diagrams can be implemented accurately to meet the business goals. The major difference between physical and logical data flow diagrams is related to their focus because physical data flow diagrams mainly focus on the implementation of the system and the other hand, logical data flow system focuses on business activities. Data flow diagrams mainly explain the data flow taking place in a business information system.
Logical data flow diagram depicts the ways a business operates and the physical flow diagram shows the ways the information system is implemented. The main focus of logical DFD is business activities and the main focus of physical DFD is the implementation of the system. So, the differences between physical and logical data flow diagrams mainly come from their focus. A process is considered to be a business activity under the logical flow diagram. But a process is considered to be a software program or any manual procedure under a physical flow diagram.
Datastore is another area where we can find the difference between logical and physical flow diagram. Datastore in a logical flow diagram depicts the explanation of the ways the data are stored in different databases. Under physical flow diagram, data store means computer files, databases, and paper files. The ways the data gets stored in the databases, paper files, or computer files are explained by a logical flow diagram descriptively. A logical flow diagram can be understood by a non-technical person but a physical data flow diagram is highly complex and it can only be interpreted by the persons having prior knowledge and technical skills.
Therefore, it can be said that the flow diagram represents the flow of data of processes or a system. Logical and physical data flow diagrams or two types of data flow diagrams and they are different from each other. It can also be said that the physical flow diagram comes from a logical flow diagram.
Why are Data Flow Diagrams Important?
The most significant aspect of a flow diagram is that it helps in keeping the program highly organized. The programmers can use data flow diagrams in planning the accomplishment of new programs efficiently. The programmers can also keep a constant track on the program with the help of data flow diagrams. In the domain of decision-building, the role of data flow diagrams is highly crucial. In every program which is available to consumers, we can find there are several parts which help in making decisions based on the data.
Such decisions can be taken either by any part of the program or by the users. Data flow diagrams support the programmers to figure out various options with the help of which the programs can be handled and data can be obtained. Data flow diagrams can help the programmers to explain the functionalities of the program to any laypeople without using any technical terminologies or computer languages which might not be understood by the laypeople. By the help of data flow diagrams, the programmers can explain the program to the people without wasting any time and effort in explaining different computer codes and languages to the non-technical people. Sometimes, the programmers realize the fact that there is always an effective way of optimizing the code.
This realization takes place during a project is in its ongoing phase when the programmers find it difficult to figure out where to use the code. The programmers might also need to modify the codes so that they could accommodate them feasibly. But with the use of a flow diagram, the programmers can able to visualize the consequences of injecting certain codes into the program. In understanding the logical movement of data in a business, the role of data flow diagrams can never be overemphasized. The systems analysts structure data flow diagrams as a tool which helps in depicting interrelated data flows and subsystems of an information system. By the help of graphical representation of the movement of data storage and data transformation, the entire information can be obtained.
The analysts usually gather sources of data processes data flows and data stores from initial organizational narratives which are provided by the users or get revealed by any data sources. This information is used to develop flow diagram based on the contexts available. The data flow diagram intricately explains the performance of the processes by different users, execution of the processes, performance of similar processes, combination of batch processes for effective processing, the combination of processes and partitioning of the processes into different programs. These are the main areas which get represented by the help of data flow diagrams. For more information related to other topics and subjects, you also check with Global Assignment Help.